Rickards Warns “Don’t Wait Too Long To Leave The Party”
By Tyler Durden – Zero Hedge
Liquidity is the ultimate paradox in finance.
It’s always there when you don’t need it and never there when you need it most. The reason is crowd behaviour, or what mathematicians call hyper-synchronicity (a fancy word for everyone doing the same thing at the same time).
When markets are calm, no one wants liquidity because investors are happy to hold stocks, bonds, currencies, commodities and other assets in their portfolios. As a result, there’s plenty of liquidity on offer from bank lenders and very few takers.
The opposite is true.
In a financial crisis, everyone wants his money back at once. Stocks are crashing, bonds are crashing, margin calls are streaming in and everyone is trying to sell everything at once to avoid losses, meet margin calls and preserve wealth.
In those circumstances, there’s not enough liquidity to go around. Banks, and ultimately regulators, decide who lives and who dies (financially speaking) by offering liquidity or cutting it off.
Investors are lulled into complacency by the illusion of liquidity in good times. Investors know that markets turn around, that bulls become bears and that the time may come when they want to take some chips off the table and move to the sidelines.
Their mistake is believing that a willing buyer or bank lender will be there for them the moment they want to sell or finance a position. If an investor unwinds a position slowly enough and early enough, liquidity may be available. But investors who stay too long at the party discover that when they want to make a move to reduce position size, everyone else is doing the same thing and the crash has already started.
That’s one of the hardest parts of investing: deciding to liquidate positions when markets are still rising and the party is still going strong. Investors are overcome with FOMO (fear of missing out). They don’t want to reduce stock positions and obtain cash only to find their neighbour is still fully invested and enjoying big gains.
The obvious question for investors is whether it’s possible to get an “early warning” or predictive analytic signal that a liquidity crunch is on the way. If such a signal were available, it might be possible to stay a little longer at the party to pick up market gains but still get out in time before the lights go out.
Right now, indications are that liquidity is growing scarce and it may be time to sell stocks and increase cash allocations.
The first is shown in Chart 1 below. The bar graph in Chart 1 shows participation at U.S. Treasury auctions over the past 10 years broken out by type of participant.
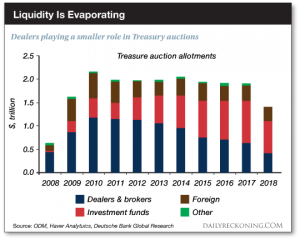
The most important participants are shown in blue. These are the dealers and brokers, consisting mainly of “primary dealers” who are obliged by the Fed to bid at auctions and make two-way markets in U.S. government securities.
The primary dealers are a leading source of liquidity in the Treasury market second only to the Fed itself. Primary dealers are required to be buyers when everyone is selling and to sell securities when everyone else wants to buy in order to maintain liquid orderly markets. As you can see, overall participation has declined sharply since 2017 in all categories, and dealer participation has steadily eroded since 2012.
Just as the Treasury has to sell record volumes of debt because of the Trump tax cuts and budget sequester repeal, the primary underwriters of that debt are backing away from the market, as are other market participants. The result is sharply falling liquidity in the world’s most important securities market.
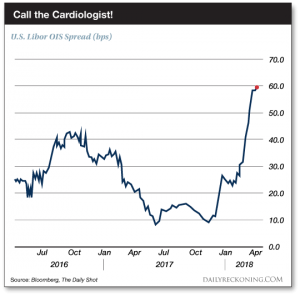
The second indication that liquidity is drying up is shown in Chart 2 below. Chart 2 shows the spread between the London Interbank Offered Rate (Libor) and the overnight indexed swap rate (OIS).
I don’t want to get too technical here, but an OIS transaction is an unsecured contract that involves two banks (or a bank and a customer) in which one party makes a fixed-rate payment and the other party makes a floating-rate payment (the overnight rate).
An OIS transaction mimics the interest-rate cash flows on a secured funding, where an investor buys a fixed-rate security and finances it in the overnight repo market. The difference in OIS deals is that there is no actual security involved. It is just an exchange, or “swap,” of interest rate payments, one fixed and one floating.
The OIS rate is typically tied to fed funds or another central bank target rate in Europe or the U.K. Libor is the rate at which banks lend excess funds to each other for short terms on an unsecured basis.
In principle, the OIS rate and Libor should be almost the same. Both are unsecured short-term rates for lending between banks. The difference is that the OIS rate is tied to a rate central banks control such as fed funds and Libor is tied to a rate the banks set between themselves. A typical spread between Libor and OIS is 10 basis points (bp), or 0.10%.
When the Libor-OIS spread widens beyond about 10 bp, it is a sign of stress or lack of liquidity in the banking system. The OIS rate stays anchored because it is linked to a central bank target rate. But Libor increases because the banks either don’t have funds to lend or begin to question the creditworthiness of the counterpart banks.At the height of the financial crisis in October 2008, the Libor-OIS spread reached an all-time high of 364 bp. The spread is nowhere near that today, but it has spiked sharply from 10 bp in late 2017 to almost 60 bp today. The spread today is at the highest level in over two years. If this were an EKG, the patient would be on his way to the cardiologist, if not quite to the emergency room.
The third indication is found in a recent Fed announcement described in an article from Reuters. The article reports on the Fed’s effort to replace Libor (discussed above) with SOFR as a benchmark rate for U.S. dollar-denominated loans and derivatives.
SOFR stands for the Secured Overnight Financing Rate. SOFR is essentially the same as the repo rate, which is the rate at which bank dealers finance inventories of government securities on an overnight basis.
Part of the reason for replacing Libor with SOFR has to do with recent scandals in the Libor market involving manipulation and price fixing by banks. It is also true that Libor is used less frequently than in the past because banks have been parking excess reserves at the Fed, so there is less interbank lending on which to price Libor.
What the Fed left out of their announcement is the obvious fact that SOFR is a securedrate while Libor is an unsecured rate. SOFR transactions involve pledges of government securities to secure the overnight loans while Libor transactions are totally unsecured loans between banks. SOFR rates will almost always be lower than Libor rates because of the security feature.
The Fed is using an apples-to-oranges rate comparison to disguise the fact that liquidity is drying up in the unsecured bank lending market. In the future, a Libor-OIS type spread or a Libor-repo spread (similar to a “TED spread”) might disappear because Libor itself has disappeared.
That’s more than a technical change in benchmark rates. It indicates the coming absence of liquidity in the unsecured bank lending market.
So there are your three early-warning signals of declining liquidity: Dealers are backing away from the market, private rate-to-central bank rate spreads are widening and the Fed is attempting an apples-to-oranges switch to hide lost liquidity in interbank markets.
My signals are saying this may be your last chance to get out of risky assets such as stocks and into more liquid positions in cash and cash equivalents. If you wait too long, the mad dash for liquidity will begin and you won’t find liquidity when you need it.